Which country is mobile first globally in 2015?
I analyzed which markets lead the mobile-first revolution by comparing user time spent and ad spend across 8 major countries—the results reveal a surprising gap.
This post was written in 2015. Some details may have changed since then.
Hi there, Mobile first has been a hot topic over the past few years globally. There are a lot of prediction on how fast mobile ad spend would grow in North America(NA), Europe(EMEA) and APAC. Hence, I want to take a look at major markets globally like the US, UK, Germany, China, Japan, Australia, South Korea, Canada and see which markets are mobile first in terms of user time spend (mobile vs desktop) and mobile ad spend as a percentage of total digital ad spend. Just for the context, eMarketer forecasts that in 2016, global mobile ad spend would surpass the US$100B mark and account for more than 50% of digital ad spend. In other words, next year globally we are officially in Mobile first territory with our digital ad spend. If you don't have a lot of time to look at individual country, here is the summary
-
- US & KR are already a mobile first market in 2015
- China is following closely (45% in 2015) with forecast to hit 50% digital spend on mobile in 2016.
- Of the top 8 countries globally in terms of mobile spend, AU, DE and CA are amongst the lowest percentage wise.
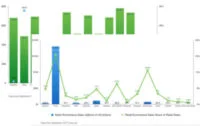
 As for time spent on mobile devices (smart phone and tablet) vs TV or laptop/desktop, the majority of the data is from Millward Brown tool here. Below is the percentage of mobile ad spend in digital ad spend against percentage of time spent on mobile devices on total time spent on mobile & Laptop. You could see that across major markets globally (US, CN, UK, JP, DE, AU, CA and KR), time spent on mobile devices is about 60% of total time spent across laptop/smart phone and tablet.
  Below is the deep dive in each country.
1.The US is a mobile first market in 2015
According to Flurry (by Yahoo) and Techcrunch, US consumers already spend more time on Mobile Apps than watching TV. Average time spent on TV in Q2'15 is 168 minutes per day vs an average 198 minutes spent on Mobile App per day.  Data from Millward Brown seems to confirm that number with 151 minutes spent on smart phone daily and 43 minutes on tablet vs 147 minutes spent on TV or 103 minutes on laptop/desktop.
  From eMarketer, Mobile is going to account for more than half (51.9%) of Digital ad spend in 2015. So technically the US is a mobile first market both from consumer time spend and ad spend.
2.China mobile ad spend accounts for 45% of all digital ad spend in 2015
It is of no surprise that the total mobile ad spend in China is second in the world, only behind the US. This year 2015, eMarketer estimates that mobile ad spend in China would be around US $14B. This is double of what it was in 2014.  2016 will be the year that mobile ad spend in China accounts for more than 50% of all digital ad spend. On the same report, by 2017, eMarketer forecasts that China would be a digital first market with 53.6% all of media ad spend is on digital channels.
  As for time shared amongst major media, consumers in China spend more than 50% of their time on digital media vs. TV (43.6%). Average time spent on smart phone (non voice) is about 33% vs. 17% on desktop/laptop.
  Millward Brown data suggests that daily time spent on smart phone and tablet (229 minutes) is about 3 times that of TV (89 minutes). I am a bit unsure about that data point as China is a vast market and I am not sure the time spent on TV is that low across China, across different demographics.
3. 40% of digital ad spend in JP is on mobile in 2015
News from eMarketer in Apr 2015 reported that this year JP digital ad spend would be around US$9.7B. Out of that, 40% or US$3.85B would be spent on Mobile. JP mobile ad spend is lower than both US and China in terms of absolute dollar value and percentage of digital spend. Consumers in Japan, however, is already spending way more time on their mobile devices in comparison to both TV and desktop/laptop. Report from Millward Brown report shows that on average Japanese people spend 150 minutes on their mobile devices (smartphone & tablet) per day vs 125 minutes for TV. 
4. The UK mobile ad spend accounts for 40% of digital ad spend
Again eMarketer estimates that 2015 mobile ad spend in the UK would be around £3.26B (US$4.97B), or 40% of £8.13B (US$12.4B) for digital ad spend. The UK is also expected to cross a major milestone this year with digital ad spend commands about 50% of total ad spend, followed by TV ad spend at 24.9% and Print at 16.6%.  People in the UK also spend more time on smart phone & tablet in comparison to TV. The data below is from Millward Brown. Total time spent on mobile devices daily is around 166 minutes vs. 148 minutes on TV or 97 minutes on laptop/desktop.
5.Germany mobile ad spend is about 30% of digital ad spend in 2015
Similar to the rest of the big markets, people in Germany spend more time on smart phone and tablet in comparison to TV, laptop. The data below from Millward Brown again  As for mobile ad spend, eMarketer suggests that the number for Germany in 2015 would be around $2.095B, 30% of $6.67B digital ad spend.
6. South Korea mobile ad spend accounts for 54.4% of digital ad spend in 2015
eMarketer estimates that in 2015, digital ad spend in South Korea would be around $2.94B. Out of this, $1.6B would be mobile ad spend.  It's a similar trend for time spent on mobile devices, with an average of 158 minutes spent on mobile vs 127 minutes on TV daily or 94 minutes for desktop/laptop
7. Australia mobile ad spend is about 28% of total digital ad spend in 2015
Mobile ad spend $1.36B, or only 28% of the estimated digital ad spend ($4.6B) in Australia in 2015. This is considerably lower than the rest of the big markets like US, CN, UK, KR. Consumers in Australia, however, are already spending more time on mobile devices (169 minutes/day) vs. TV (125 minutes/day) or Desktop (102 minutes) 
8. Canada mobile ad spend would be around 33.7% of digital ad spend in 2015
IAB Canada estimated that 2015 digital ad spend would be around $4.2B. eMarketer estimated mobile ad spend in Canada to be around $1.416B in 2015.  That's all that I have for now. Cheers, Chandler