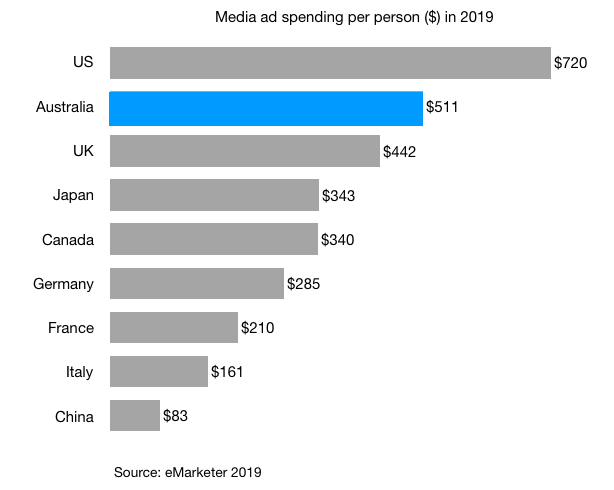
1. Media ad spending per person in Australia is higher than most G7 countries and China
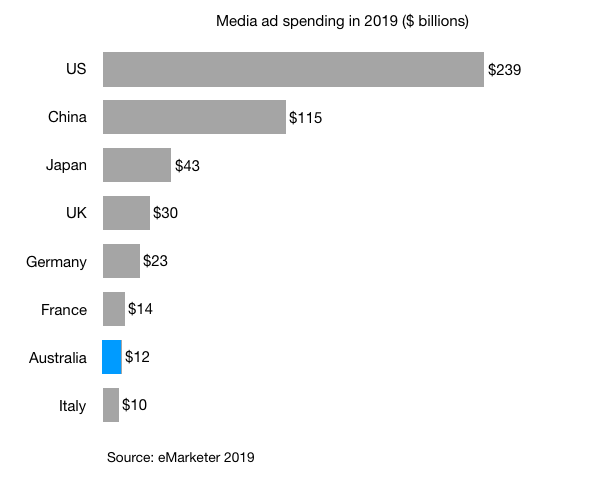
![media ad spending per person in 2019 in australia us uk japan germany china italy france](https://www.chandlernguyen.com/wp-content/uploads/2019/10/media-ad-spending-per-person-in-2019-in-australia-us-uk-japan-germany-china-italy-france.png)
Given the size of the population, it is not a surprise that their total media ad spending is tiny in comparison to other G7 countries and China.
![media ad spending in 2019 in us china japan uk germany france australia italy](https://www.chandlernguyen.com/wp-content/uploads/2019/10/media-ad-spending-in-2019-in-us-china-japan-uk-germany-france-australia-italy.png)
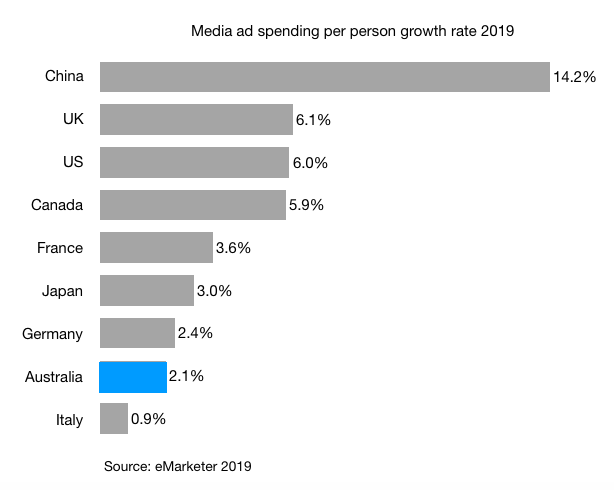
Given the high base, it is not surprising that Australia total ad spending per person growth is expected to be flat in the next few years.
![Media ad spending per person growth rate 2019 Australia china us uk France Germany Italy Canada Japan](https://www.chandlernguyen.com/wp-content/uploads/2019/10/Media-ad-spending-per-person-growth-rate-2019-Australia-china-us-uk-France-Germany-Italy-Canada-Japan.png)
2. Australian consumers spend a roughly equal amount of time on TV and the internet
![average time spent per media in australia per day 2018 - 2020](https://www.chandlernguyen.com/wp-content/uploads/2019/10/average-time-spent-per-media-in-australia-per-day-2018-2020.png)
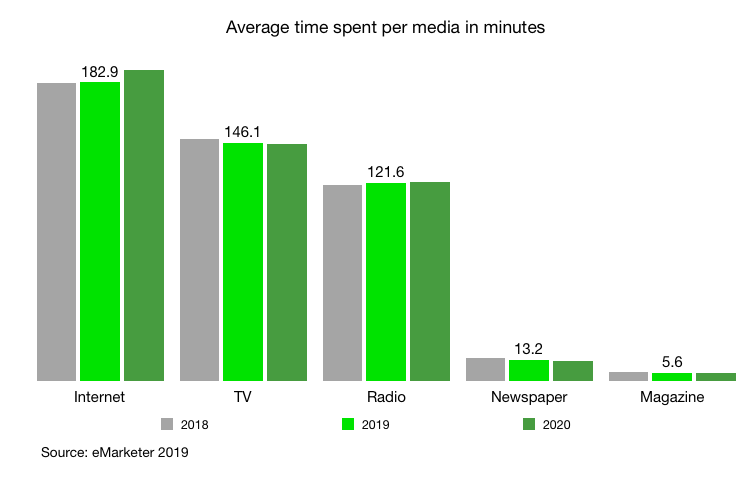
It is interesting to note that Radio remains stable over the past six years and continue to play a significant role in how Australian consumers spend their time with Media.
3. Given the time spent per media, digital has an outsized share of the total ad spending, while Radio has a smaller share
![media ad spending share per media in australia 2018](https://www.chandlernguyen.com/wp-content/uploads/2019/10/media-ad-spending-share-per-media-in-australia-2018.png)
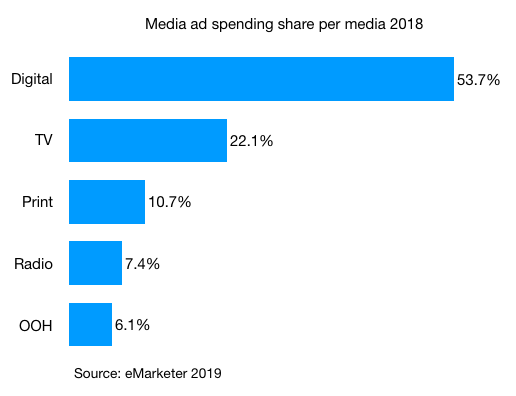
TV perhaps should command a proportionately more significant share of the total ad spending?
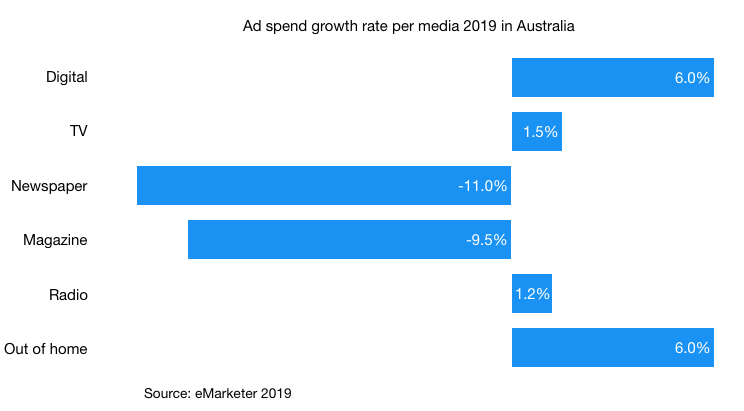
4. Over the next 3-5 years, most of the growth is coming from Digital and Out of Home, with print ad declining quickly
![ad spending growth rate per media in australia 2019](https://www.chandlernguyen.com/wp-content/uploads/2019/10/ad-spending-growth-rate-per-media-in-australia-2019.png)
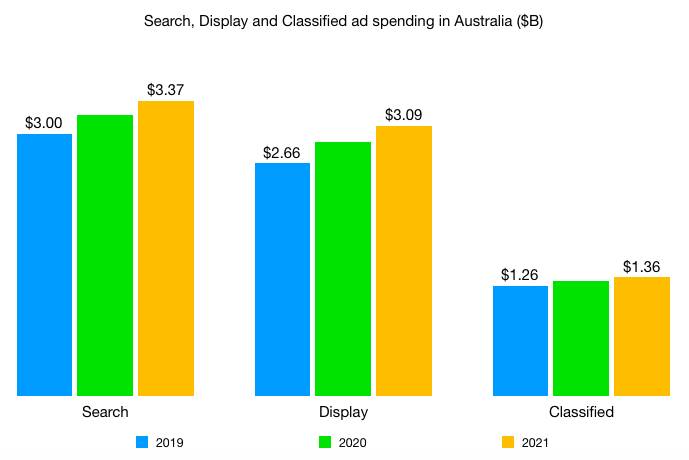
5. Within Digital, Search continues to edge display ad spend out in the next few years
![search display and classified media spend in australia 2019 - 2021](https://www.chandlernguyen.com/wp-content/uploads/2019/10/search-display-and-classified-media-spend-in-australia-2019-2021.png)
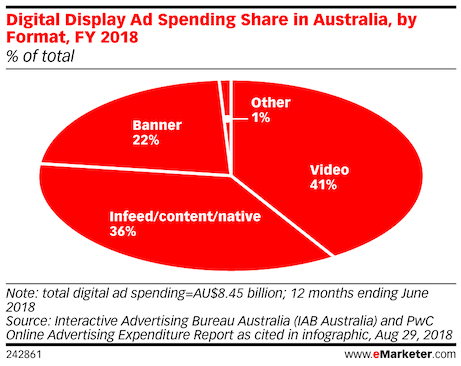
6. Within Digital display, it is not surprising that video format takes the largest share (41%)
![digital display ad spending share by format 2018 v2](https://www.chandlernguyen.com/wp-content/uploads/2019/02/digital-display-ad-spending-share-by-format-2018-v2.jpg)
7. Depending on content type, a sizeable percentage of the Australia consumers are willing to pay for content to avoid ads
![Percentage of Australian consumers willing to pay to avoid ads Deloitte report 2018](https://www.chandlernguyen.com/wp-content/uploads/2019/10/Percentage-of-Australian-consumers-willing-to-pay-to-avoid-ads-Deloitte-report-2018.png)
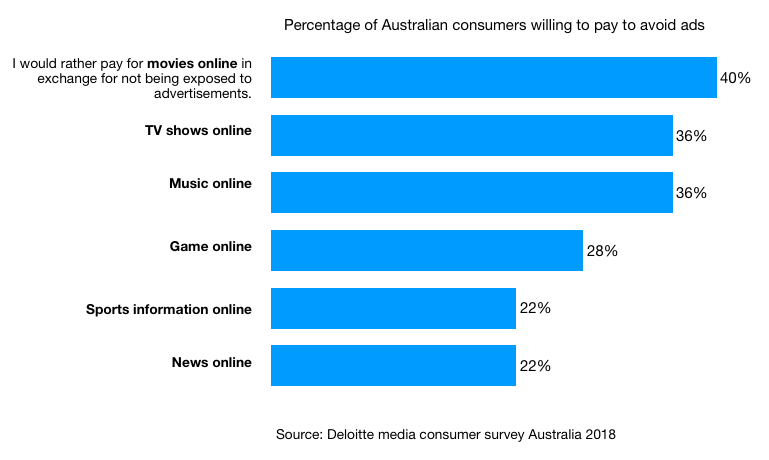
Deloitte Media consumer survey Australia 2018.
8. Ad blocking penetration in Australia is the highest in comparison to other G7 countries
![ad blocking penetration in australia us uk canada germany japan italy 2018](https://www.chandlernguyen.com/wp-content/uploads/2019/10/ad-blocking-penetration-in-australia-us-uk-canada-germany-japan-italy-2018-1024x875.jpg)
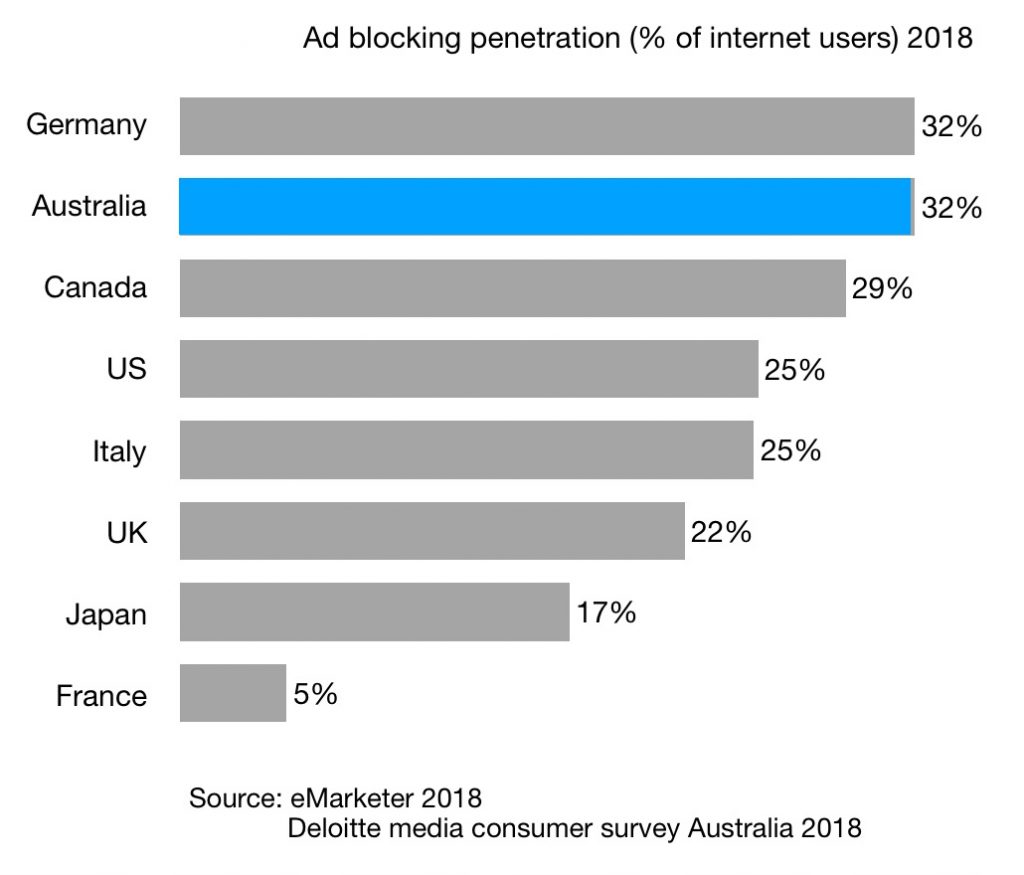
From the same Deloitte report, the Australian ad blocking penetration rose from 28% in 2016 to 32% in 2018. This increase is similar to the UK.
That’s all from me for today.
Cheers,
Chandler