8 key facts about South Korea Mobile Game Industry (update Mar 2019)
South Korea's mobile gaming market ranks 4th globally with remarkably high revenue per paying user, yet lower user acquisition costs than the US—making it a prime target for game developers.
This post was written in 2019. Some details may have changed since then.
Hi there,
Similar to recent posts, this is an update of a popular post back in Dec 2016 "key facts about South Korea Mobile Game". I use the latest information from eMarketer, NewZoo, App Annie, AppsFlyer and other sources.
This post is part of the series about South Korea that I have been writing in 2019. You can find other posts here:
South Korea subscription Video on demand (SVOD): key facts and trends
10 key facts about South Korea e-commerce
South Korea digital marketing landscape (updated 2019)
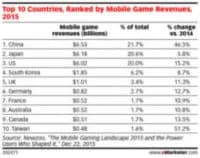
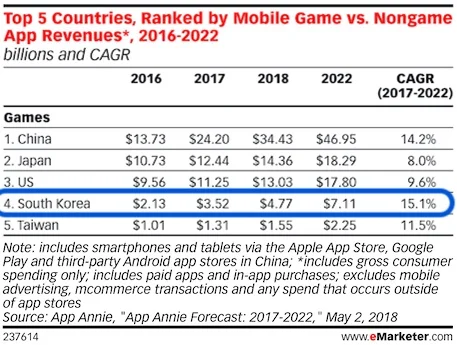
1. South Korea ranks number 4th in the world in terms of Mobile Game revenue (and expected to continue keeping that position)
2. Gamer penetration (of the total population) in South Korea is comparable with the rest of the top 4 markets
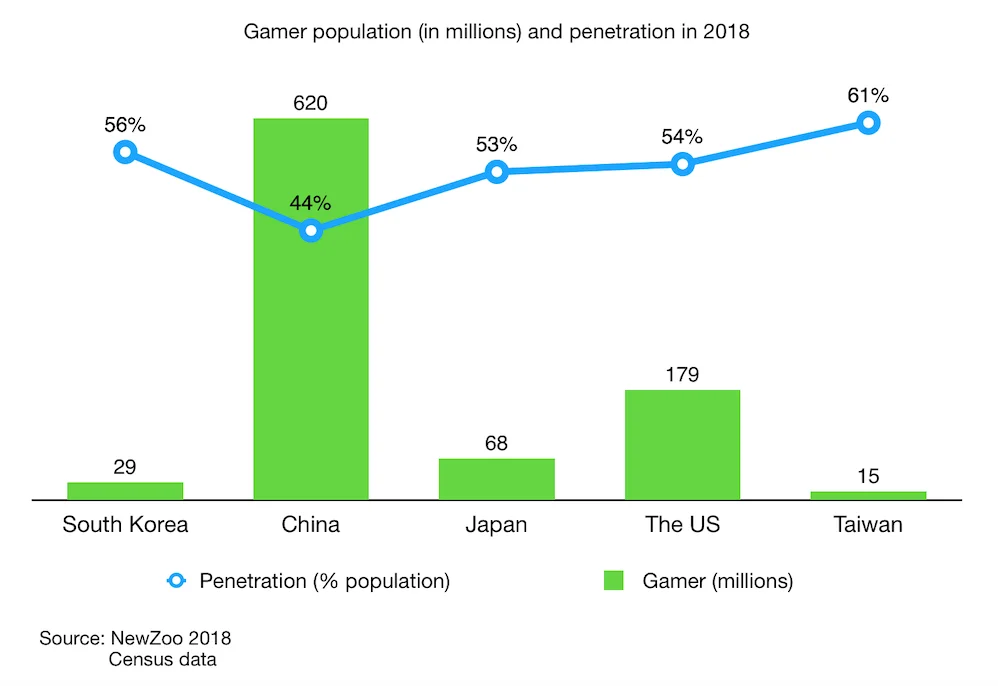
China gamer penetration is lower but given the scale of the market, this is totally understandable.
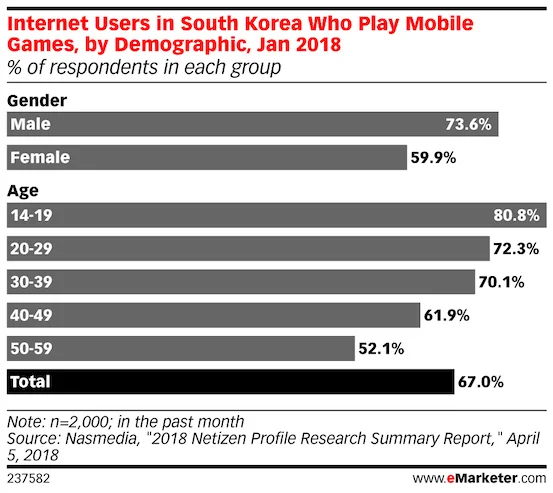
3. South Korea gamers are slightly skewed towards male and younger age group
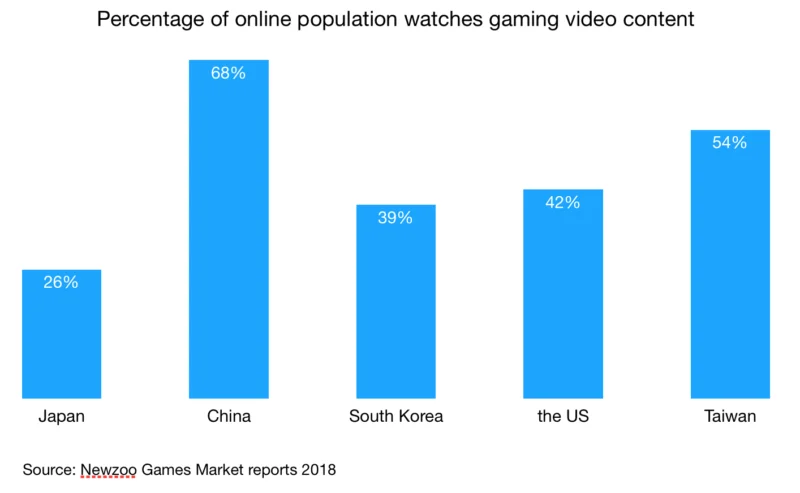
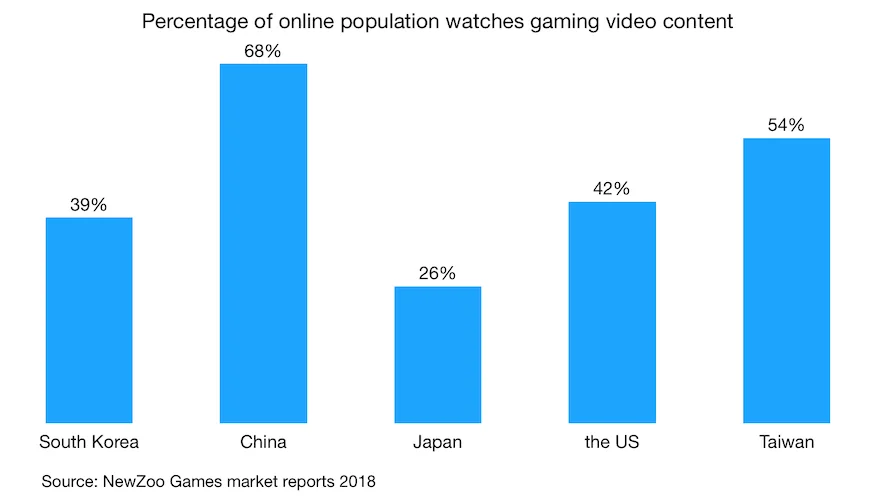
4. Two out of 5 internet users in South Korea watch gaming video content (which is lesser than China, the US and Taiwan)
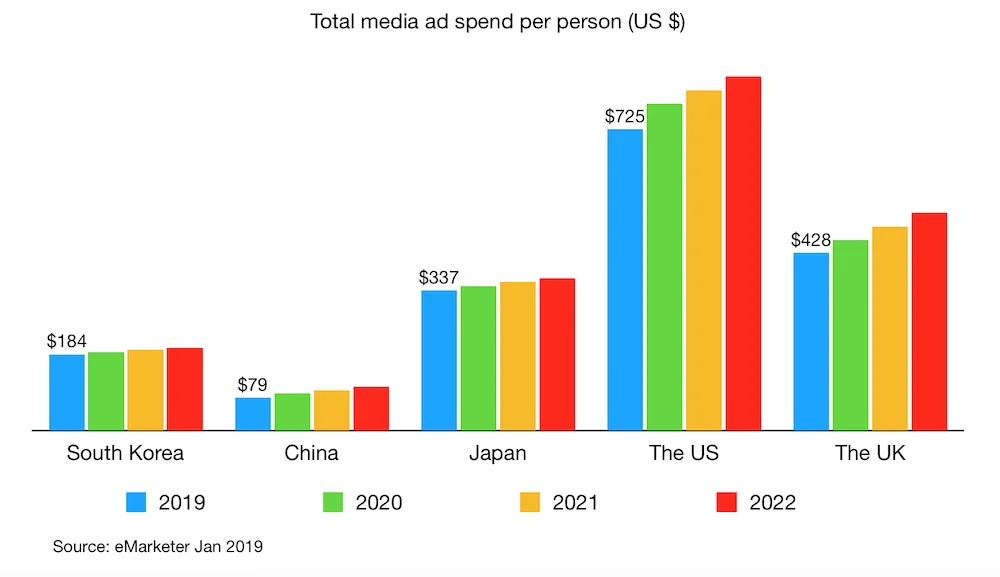
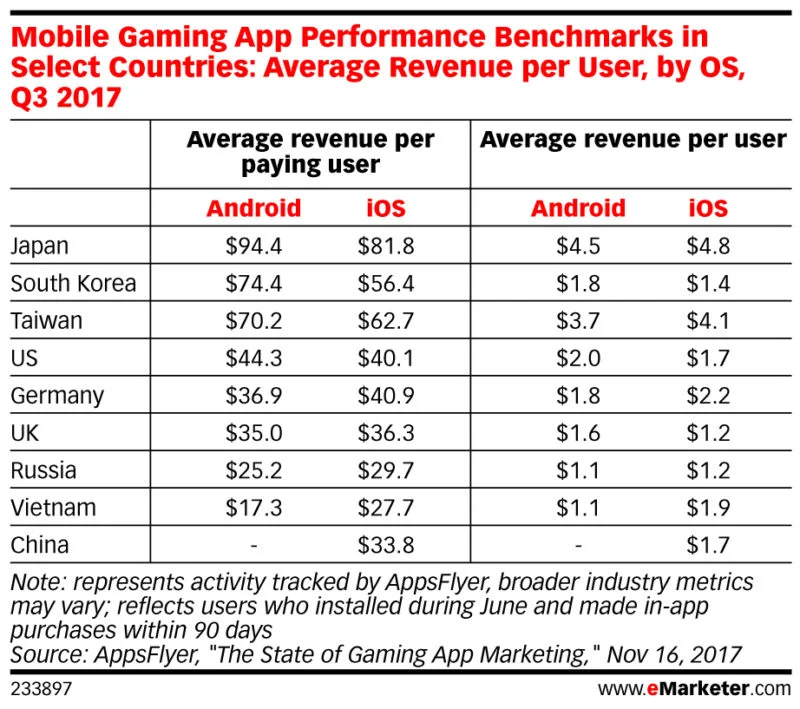
5. Average revenue per paying gamers in South Korea is amongst the highest in the world
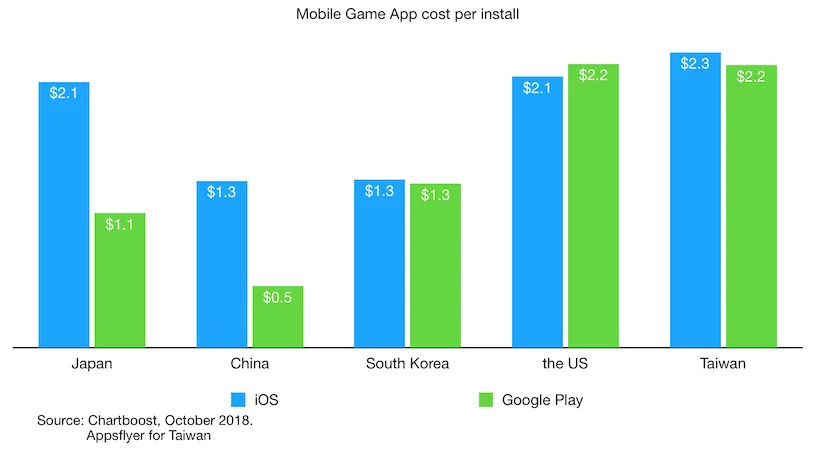
6. Given the revenue per paid gamer, the cost per game app install (CPI) in South Korea is more advantageous than CPI in the US and Taiwan
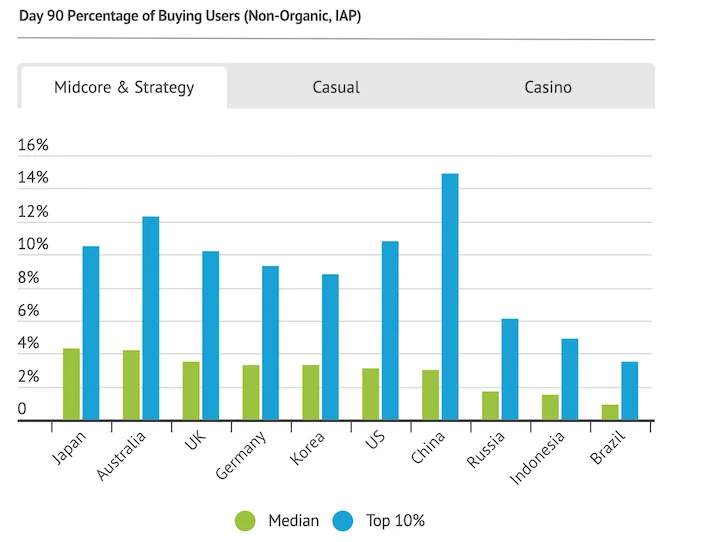
7. The retention rate for non organic gamers in South Korea is slightly smaller than the leaders Japan and Australia
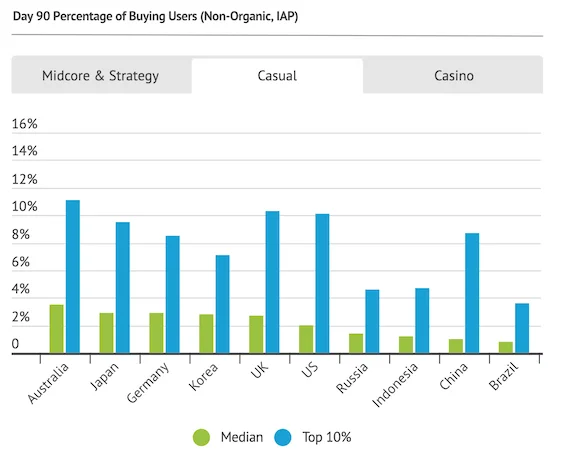
The same trend is seen for casual game
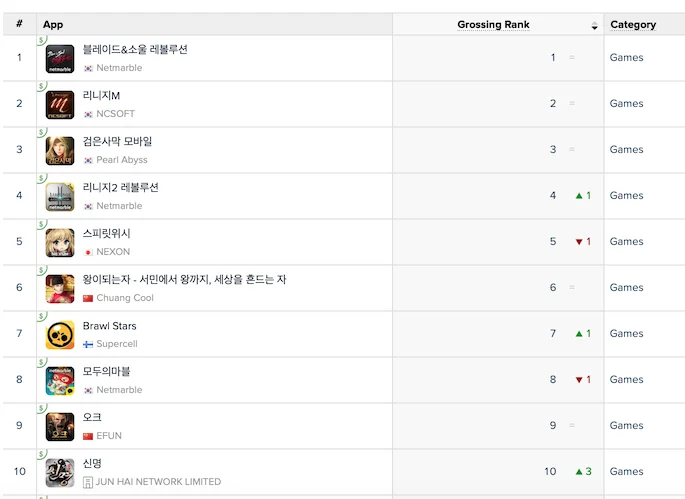
8. 90% of the top 10 grossing games in South Korea are Role Playing games, which shows the continued strength of the genre
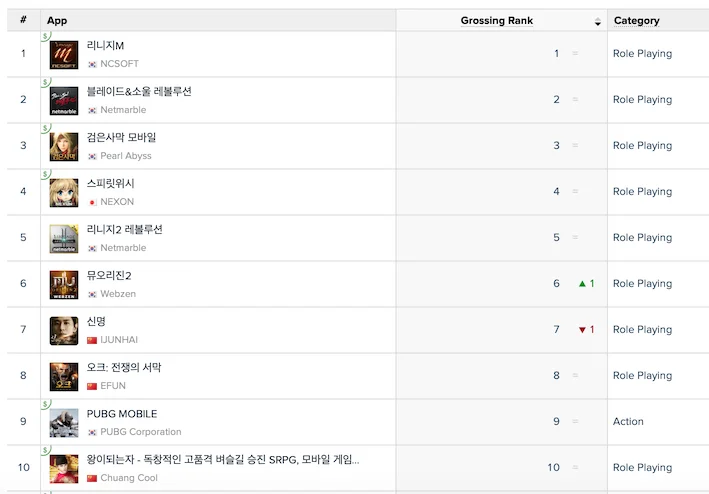
we observe a similar trend on Apple store as below
That's all from me.
Cheers,
Chandler