The California School Dashboard is an online tool that provides valuable information about California’s schools and districts. It serves as a one-stop shop for parents, educators, and community members to access data about the performance of schools and districts in California. As a parent living in California, I recently came across this website and was impressed with the wealth of information it provides. In this review, I will evaluate the California School Dashboard website, discuss its features, and assess its usefulness.
Why was the California school dashboard created?
According to the official introduction video, the dashboard was created to help parents, educators, and community members to start meaningful conversations about education in California. It also helps to provide transparency and accountability in the state’s education system. It presents a range of information about schools and districts in California, including student performance data, graduation rates, suspension rates, and college readiness.
Important details to note from the website:
“The Dashboard is the result of hundreds of meetings with parents/caregivers, teachers, students and community members who provided feedback and suggestions on the school accountability system. A consistent piece of feedback was that reducing the multiple measures (or indicators) to a single number would leave out information that is important to many parents/caregivers and educational partners.
Parents/caregivers said they are used to getting report cards showing how their child is doing. Just as the information about different subjects/courses helps them understand how their child is doing, the performance information on different measures will help them understand how the school or local educational agency is doing.”
What are the state indicators?
These indicators are included on the website and you can see how each school district, each school is evaluated across these indicators:
- Academic Performance Indicators (reported separately for English language arts/literacy [ELA] and mathematics assessments)
- English Learner Progress
- Chronic Absenteeism
- Graduation Rate
- Suspension Rate
- College/Career
The data is updated annually in December. More information can be found here or here.
What can you find on the website?
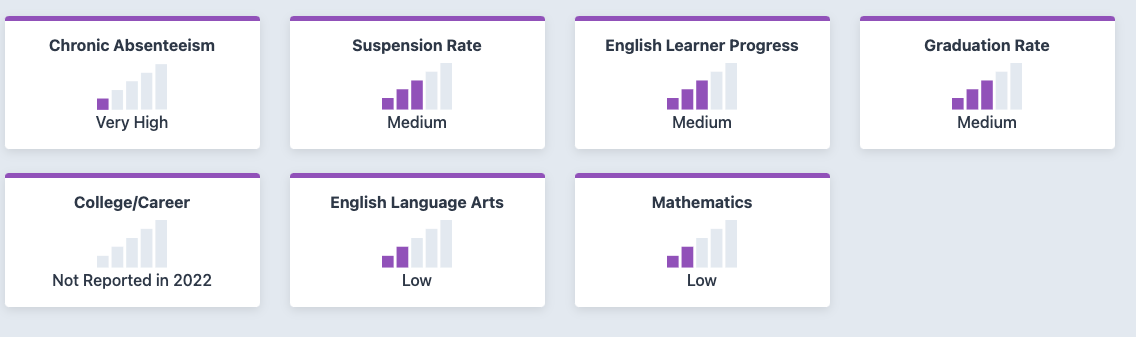
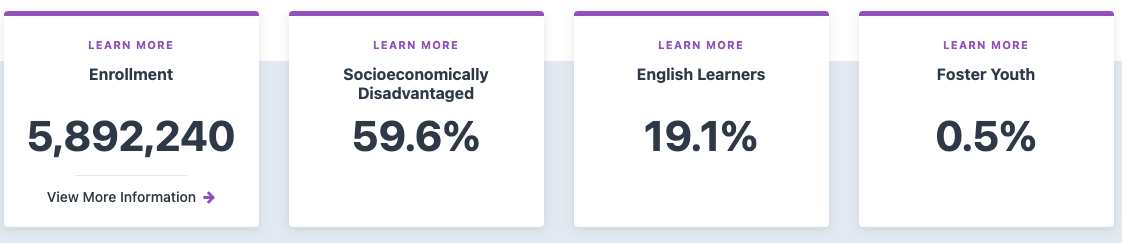
The state’s overall educational indicators are easy to find on the website. This information may not be very helpful for parents but at least they give you a broad picture of how big and diverse the student population in California are.
I didn’t know that there are more than 5.8 million students in the state, about 60% of them are classified as socioeconomically disadvantaged, and 19% are English learners (Students who are learning to communicate effectively in English, typically requiring instruction in both the English Language and in their academic courses.) When it comes to academic achievement, California students overall score low for English language arts and Mathematics.
Given the state’s size, it is more meaningful for parents to search for information related to a particular school district or school.
Useful information for parents
There are two main ways to go about doing this. If you already know which school you are interested in to know more, then directly search for that school name using the search function.
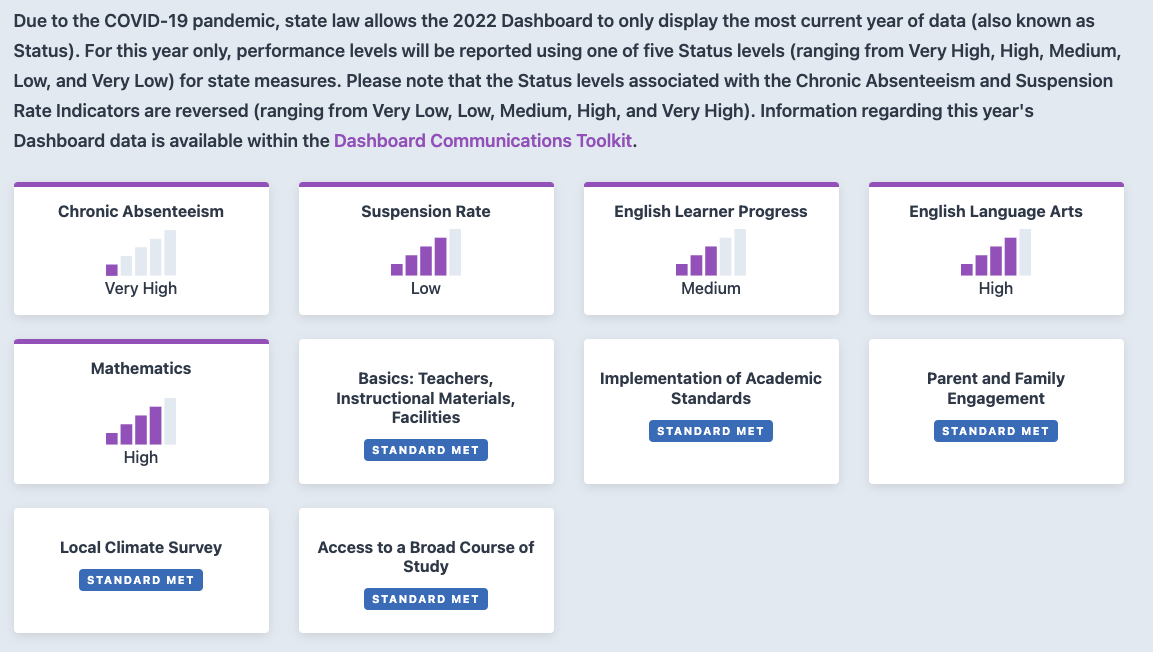
Alternatively, you can also search to look at the overall performance of a school district. For example, here is the overview of the San Mateo – Foster City district performance.
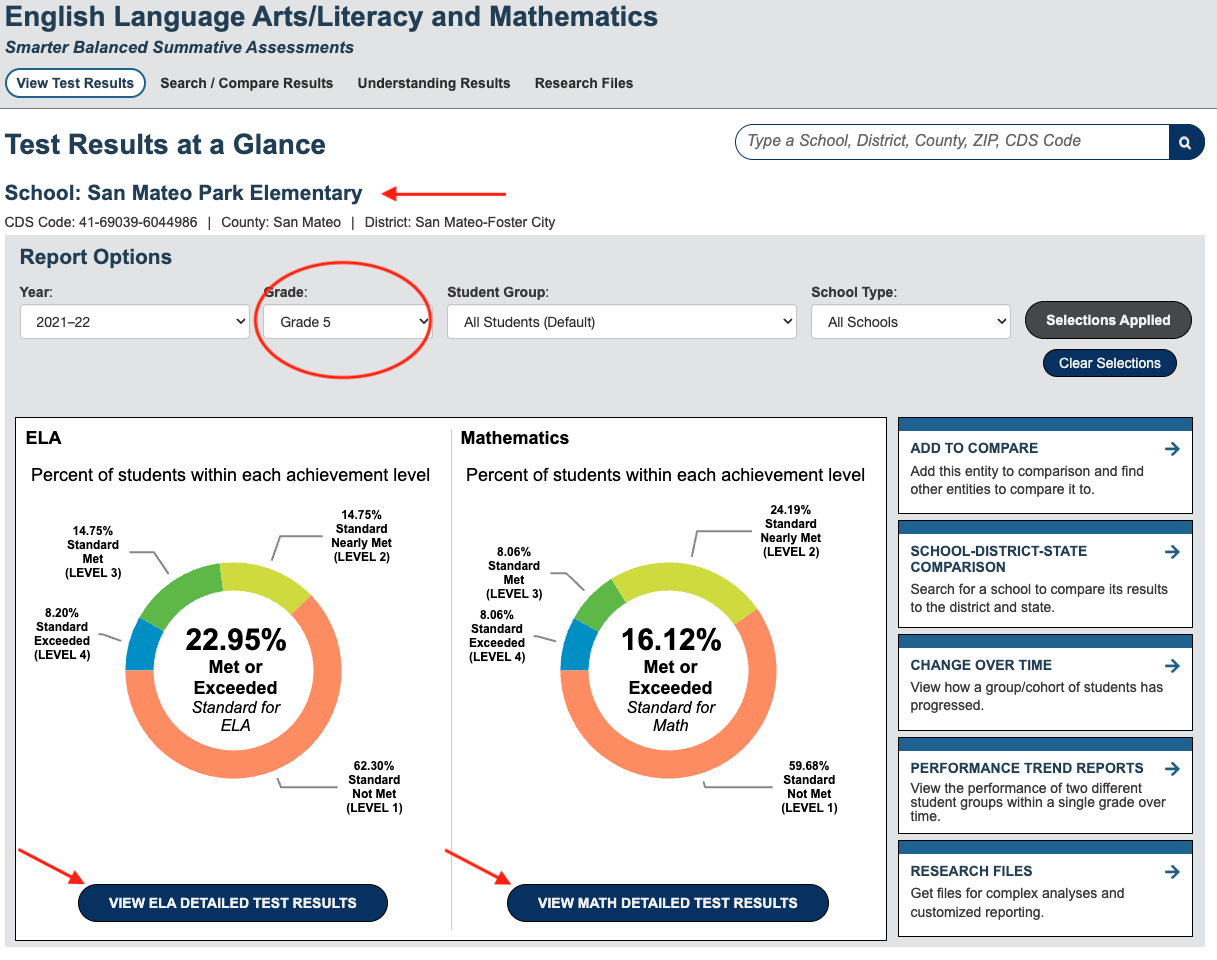
Want to dig deeper, use Data quest
If the topline information is not enough for you and you want to deep dive into a particular school, their performance trend over time, for a particular grade, use Data Quest. An example is below for San Mateo Park Elementary school, their student performance in English Language Art (ELA) and Maths, for the year 2021 – 2022.
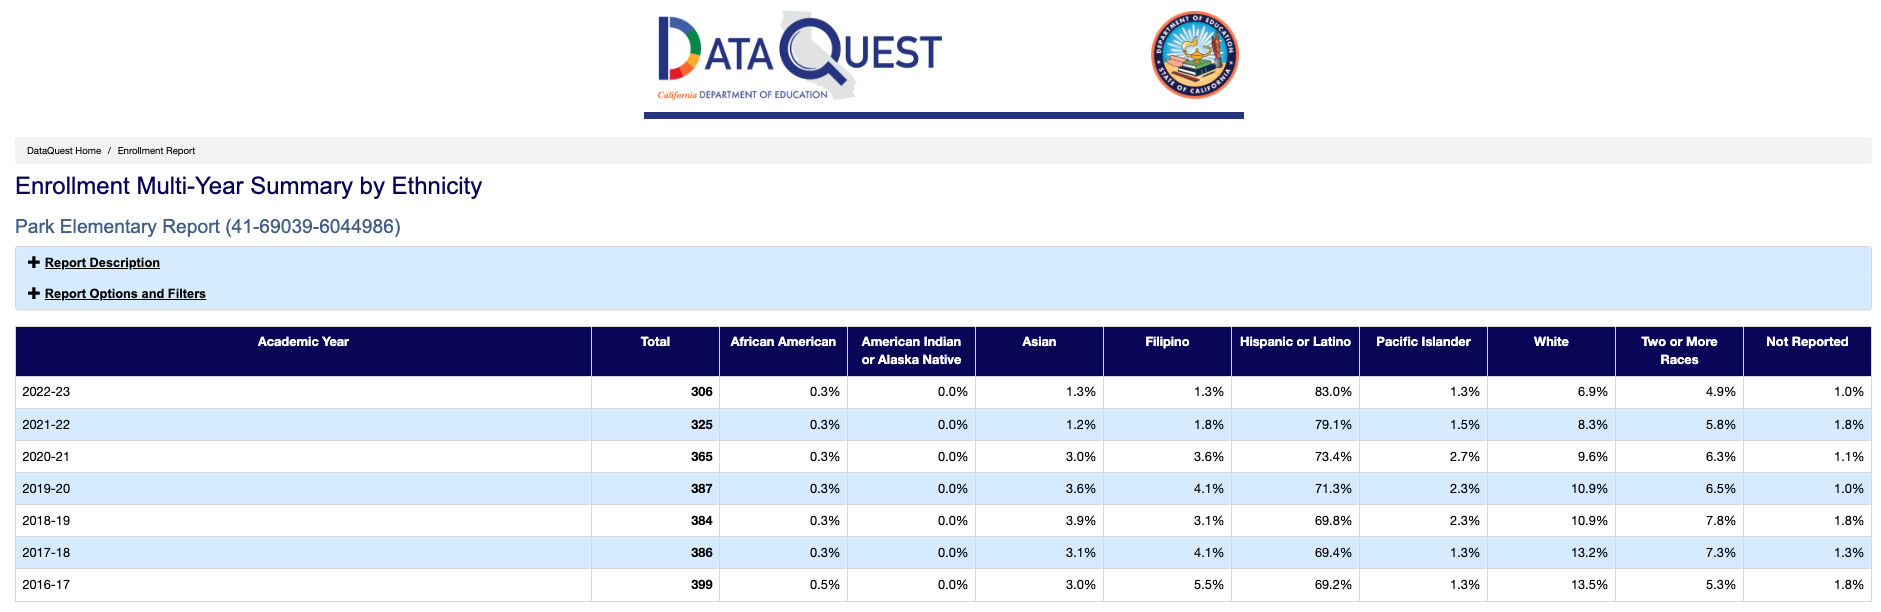
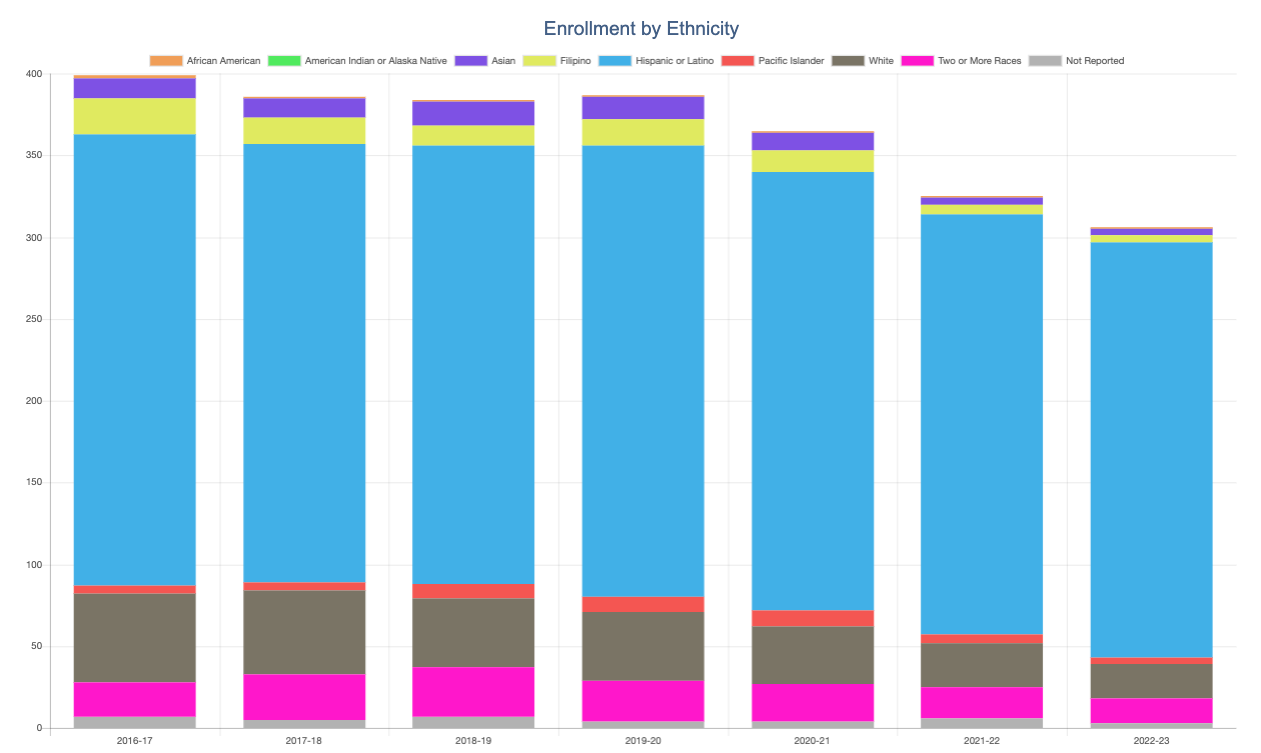
or if you want to understand enrollment by ethnicity, you can find that information too, across years using Data Quest.
Conclusion
In summary, the California School Dashboard is an invaluable tool for parents seeking to understand and compare schools in the state. Its comprehensive approach, focus on equity, and user-friendly design make it an essential resource for families navigating the education landscape. By using the Dashboard to inform their decision-making process, parents can become active partners in their child’s education and contribute to creating equitable, high-quality learning environments for all students.
[jetpack_subscription_form]