This is a topic that is dear to my heart. I feel that just like any marketing activities, with social media your ultimate goal should be revenue besides Reach (fans) and Engagement. If you have a great campaign but it doesn’t generate any uplift in revenue over short, medium or long term, then what ‘s the use?
- Reach
- Engagement
- Revenue (Bottom line)
Reach of your social media assets
To understand how many people you reach via your social media assets, there are many metrics we could use, depending on which social platform you use.
For Facebook, what you could measure over time are:
- Fan growth/Total Fans over time
- Actual Reach vs Total number of fans. This could be measured as a percentage.
- Viral uplift
Fan growth is easy to know. Facebook insights could give you that figure over time.
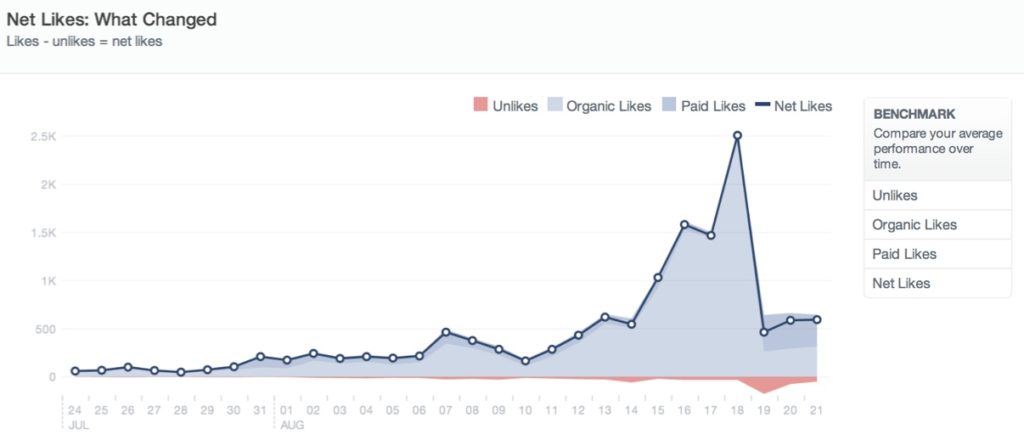
From the screenshot above, you could see daily organic likes, paid likes, Unlikes and Net Likes. Obviously if you have a high percentage of Organic Likes, it means your content strategy, engagement activities are working well.
For Actual Reach per post, we could calculate average reach per post (average unique impression per post) and then divide it by the total number of fans per day.
For example, if the total impressions for 10 posts is 100,000, then average reach per post is 10,000.
If the average number of fans per day during the duration is 40,000 then our reach rate is 25% (10,000/40,000).
Tracking Reach rate over time could be useful to understand how well your content is performing according to Facebook EdgeRank.
Viral uplift could be used to measure the additional, viral impressions you receive from your fans’ network, because fans like/share/comment on your posts. Viral uplift could be calculate as percentage of the total impressions for all of your posts during a particular period. Facebook insights raw data include viral impression.
Engagement rate
People define engagement differently for different platform.
Avinash wrote a beautiful piece about this. It’s called “Best Social Media Metrics: Conversation, Amplification, Applause, Economic Value”
In this piece, Avinash talked about three key metrics when it comes to engagement on social media. They are:
- Conversation Rate = # of Audience Comments (or Replies) Per Post
- Amplification Rate:
- On Twitter: Amplification = # of Retweets Per Tweet
- On Facebook, Google Plus: Amplification = # of Shares Per Post
- Applause rate:
- On Twitter: Applause Rate = # of Favorite Clicks Per Post
- On Facebook: Applause Rate = # of Likes Per Post
- On Google Plus: Applause Rate = # of +1s Per Post
Personally I think we may need to calculate the above metrics by percentage because obviously, if you have a bigger fan base, your absolute number may be bigger.
The below is suggested metrics that you could use:
| Metrics | Definition | Examples |
| Fans | Average daily number of fans | 12,000 |
| Impressions | Total number of unique impressions generated by posts during the period | 200,000 |
| Posts | Total number of posts | 60 |
| Comments | Total number of comments for all posts | 7,000 |
| Like | Total number of likes for all posts | 10,000 |
| Share | Total number of shares for all posts | 2,000 |
| Average Impression/Post | Average Unique number of fans see a post | 3,333 |
| Conversation rate | Average number of comments per post | 116.6 |
| Amplification rate | Average number of shares per post | 33.3 |
| Applause rate | Average number of likes per post | 166.6 |
| Reach rate | Average percentage of fans reached with any one post (Avg Imp/Fans) | 3,333/12000 = 28% |
| Conversation rate (%) | Average percentage of fans who comment on any one post | 116.6/12,000 = 0.96% |
| Amplification rate (%) | Average percentage of fans who share on any one post | 33.3/12,000 = 0.27% |
| Applause rate | Average percentage of fans who like on any one post | 166.6/12,000 = 1.38% |
| Engagement Rate (%) | Average percentage of fans who like/share/comment on any post | (116.6+33.3+166.6)/12,000 = 2.63% |
Engagement rate is sum of Conversation rate, amplification rate and applause rate.
The above table could look intimidating. Personally I would recommend tracking these metrics over time to see the trend. Reach rate, conversation rate, amplification rate and applause rate (%) are critical factors to see if your fans really engage with your content.
Like (applause) is considered the easiest to achieve in comparison to comment (conversation) and the hardest is share (Amplification). If you want to have great viral uplift, you need to track these metrics.
Example of these graphs could be like the ones below:
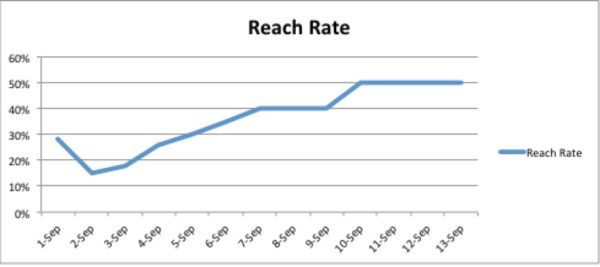
With reach rate of about 40%+ on average, if you are not using ads, that means your content is doing very well. Remember, the average is around 10%.
Graphical example of engagement rate, applause rate, conversation rate, amplification rate over time shown in this graph below.
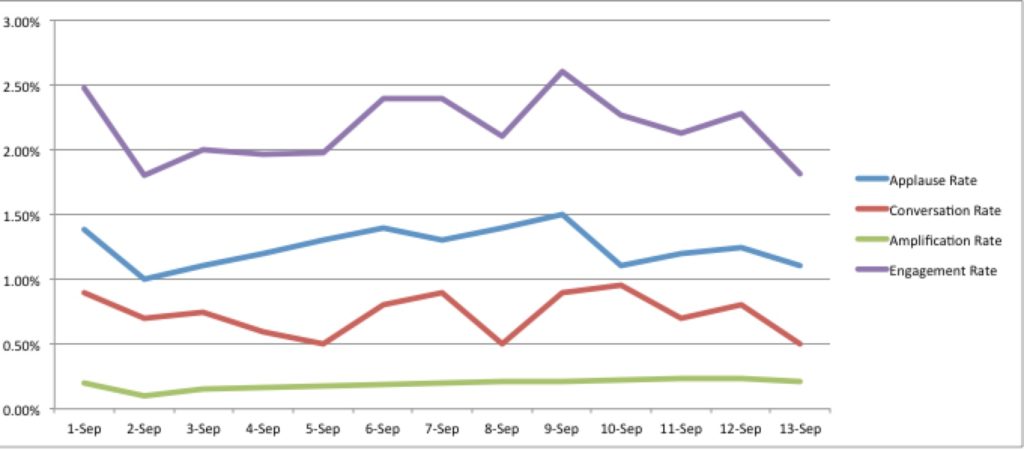
Over two weeks period, the overall engagement rate fluctuates around 2%+. First off, this is a high engagement rate from my experience in Vietnam.
The peak around 9 Sept is worth investigated more.
Since this is just an example and without other information, there is not much that we could analyze here.
Bottom line
Just like any activities, we need to somehow match what we spend (time, efforts, money) with the revenue generated or total economic value. We shouldn’t treat social media any difference.
Another way to think about this is to think about what metrics do you use to measure a media campaign? Reach, visit, conversions? e commerce transactions? goals?
Well we could do exactly the same with social media.
The reach is quite straight forwards looking at the number of fan and the total number of impressions.
For other metrics like visits, conversions, goals, e-commerce transactions, Google Analytics could provide quite a lot of information.
You should look at Traffic sources>Social like the screenshot below.
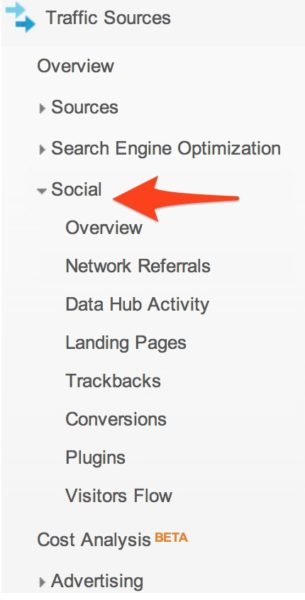
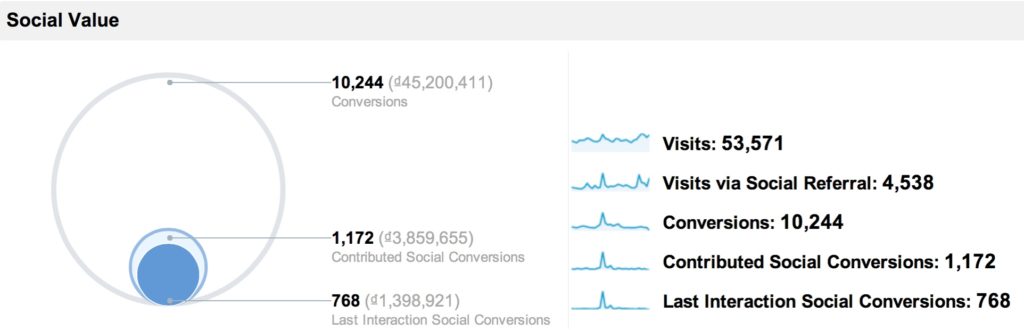
At one glance, Google Analytics shows you how many visits you have from social media, how many conversions come from social networks and the value of those conversions. Yay! Now you could go back and tell your boss that the company spends $100 on social media and actually get $150 in return!
If you want to, you could go further and quantify the visits, value coming from each social media platform that you participate in! Powerful isn’t it? You could start to see the value of YouTube, or blogger or Linkedin with your goals, your bottom line.
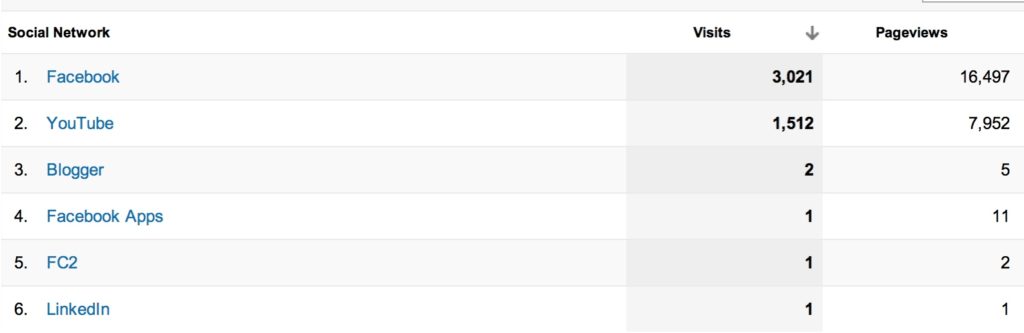
You could explore the rest of the reports under “Social” category in Google Analytics yourself, I hope.
That’s it from me. Feel free to drop any comments/feedbacks.
Cheers,
Chandler
P.S: the above is an extract from my latest ebook about Vietnam Digital Marketing, under Social Media Assets chapter.